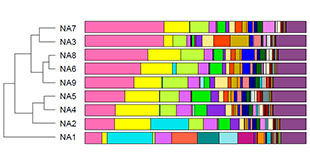


群落生态学中研究微生物多样性,通过单样品的多样性分析(Alpha 多样性)可以反映微生物群落的丰度和多样性,包括一系列统计学分析指数估计环境群落的物种丰度和多样性。
计算菌群丰度(Community richness)的指数有:
(1)Chao – the Chao1 estimator (http://www.mothur.org/wiki/Chao);是用chao1 算法估计样品中所含OTU 数目的指数,chao1 在生态学中常用来估计物种总数,由Chao (1984) 最早提出;本次分析使用计算公式如下:
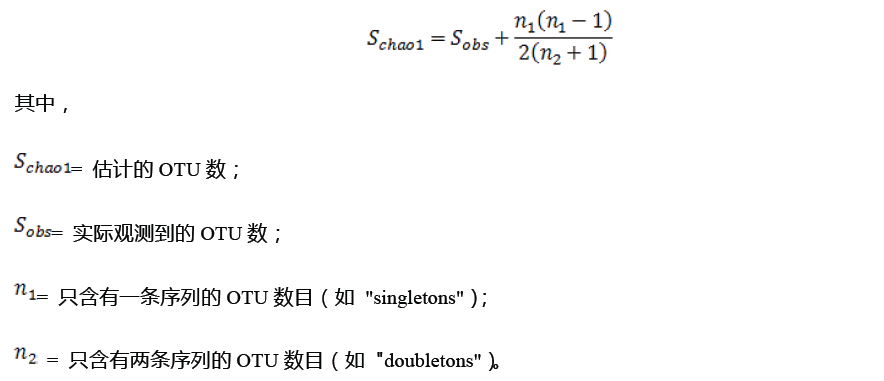
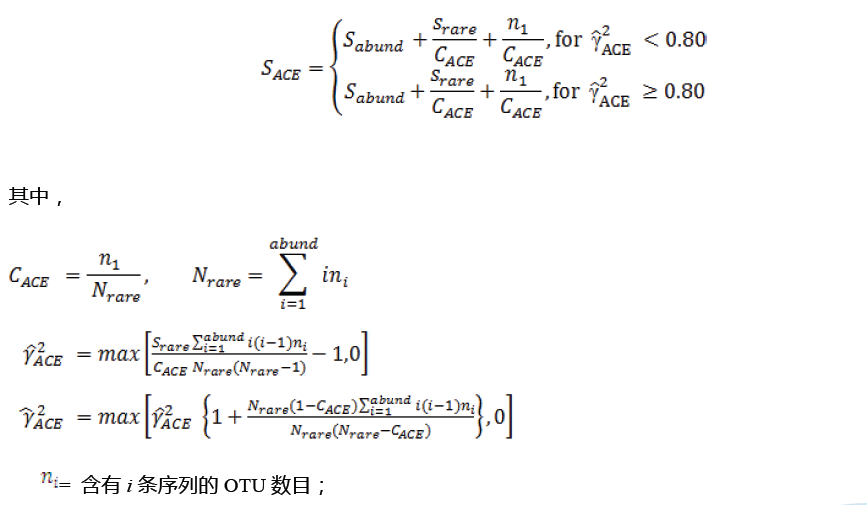
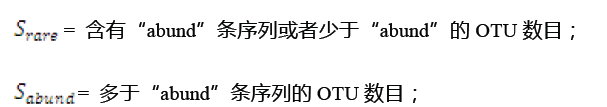
(2)Ace – the ACE estimator (http://www.mothur.org/wiki/Ace);用来估计群落中OTU 数目的指数,由Chao 提出,是生态学中估计物种总数的常用指数之一,与Chao 1 的算法不同。本次分析使用计算公式如下:
计算菌群多样性(Community diversity)的指数有:
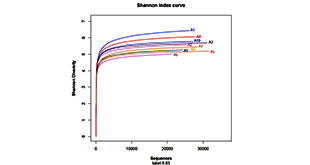
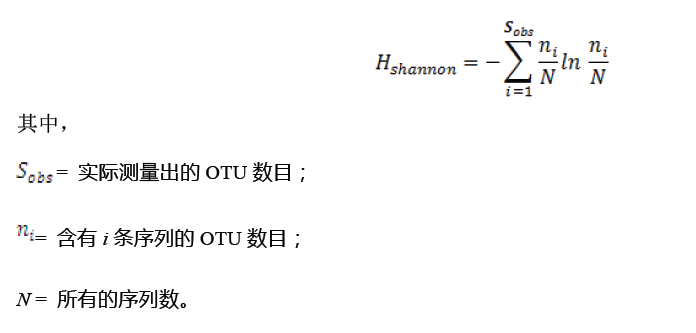
(1)Shannon – the Shannon index (http://www.mothur.org/wiki/Shannon);用来估算样品中微生物多样性指数之一。它与Simpson 多样性指数常用于反映alpha 多样性指数。Shannon 值越大,说明群落多样性越高。
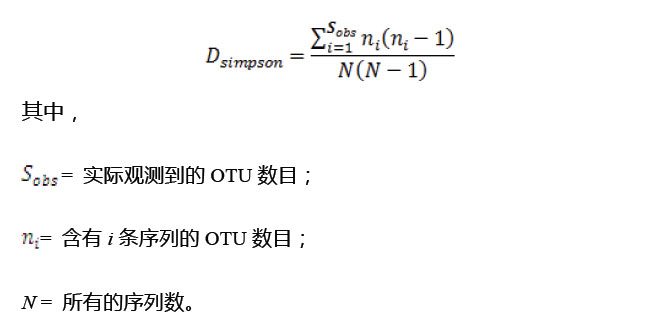
(2)Simpson – the Simpson index (http://www.mothur.org/wiki/Simpson);用来估算样品中微生物多样性指数之一,由Edward Hugh Simpson ( 1949) 提出,在生态学中常用来定量描述一个区域的生物多样性。Simpson 指数值越大,说明群落多样性越低;
分析软件: mothur [1] ( version v.1.30.1 http://www.mothur.org/ wiki/Schloss_SOP #Alpha_ diversity) 指数分析,用于指数评估的OTU 相似水平97% (0.97)

Table:Community richness estimator

Table :Community diversity estimator
注:由于数据样品较多,此处以图例形式列出部分。
其中label: 0.03 即相似水平;
ace\chao\ simpson\ simpson:分别代表各个指数;
*_lci\ *_hci :分别表示统计学中的下限和上限值。
样本信息及多样性指数统计结果如下:
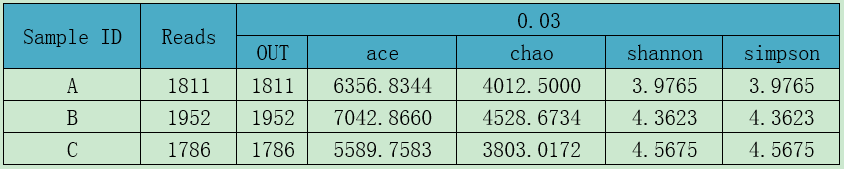
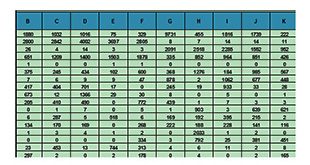
Table :Estimators table
注:
Sample ID:样品名称;Reads:被分入所有OTU 中的总优化序列数;
OTU:本次实验中该样品优化序列划分得到的OTU 数目;
Chao,Ace,Coverage,Shannon,Simpson:分别表示各个指数;
0.03:相似性水平为0.97。
参考文献:
[1] Schloss PD, Gevers D, Westcott SL (2011) Reducing the Effects of PCR Amplification and Sequencing Artifacts on 16S rRNA-Based Studies. PLoS ONE 6(12): e27310. doi:10.1371/ journal. pone.0027310.